
Population tells only part of the story. Understanding Groesbeck's market means looking at who lives nearby, where visitors come from, and how they engage with the community.
01 / Resident Market
Within a 15-minute drive of Groesbeck, nearly 9,600 residents make up the immediate residential market. This area encompasses Groesbeck and surrounding rural households, providing a practical starting point for understanding local consumer characteristics.
9,599
Residents
39.7
Median Age
3,346
Households
2.65
Median Household Size
$59,270
Median Household Income
$50.4K
Median Disposable Income
15-Minute Market Map
Everywhere within a 15-minute drive of central Groesbeck · click to enlarge
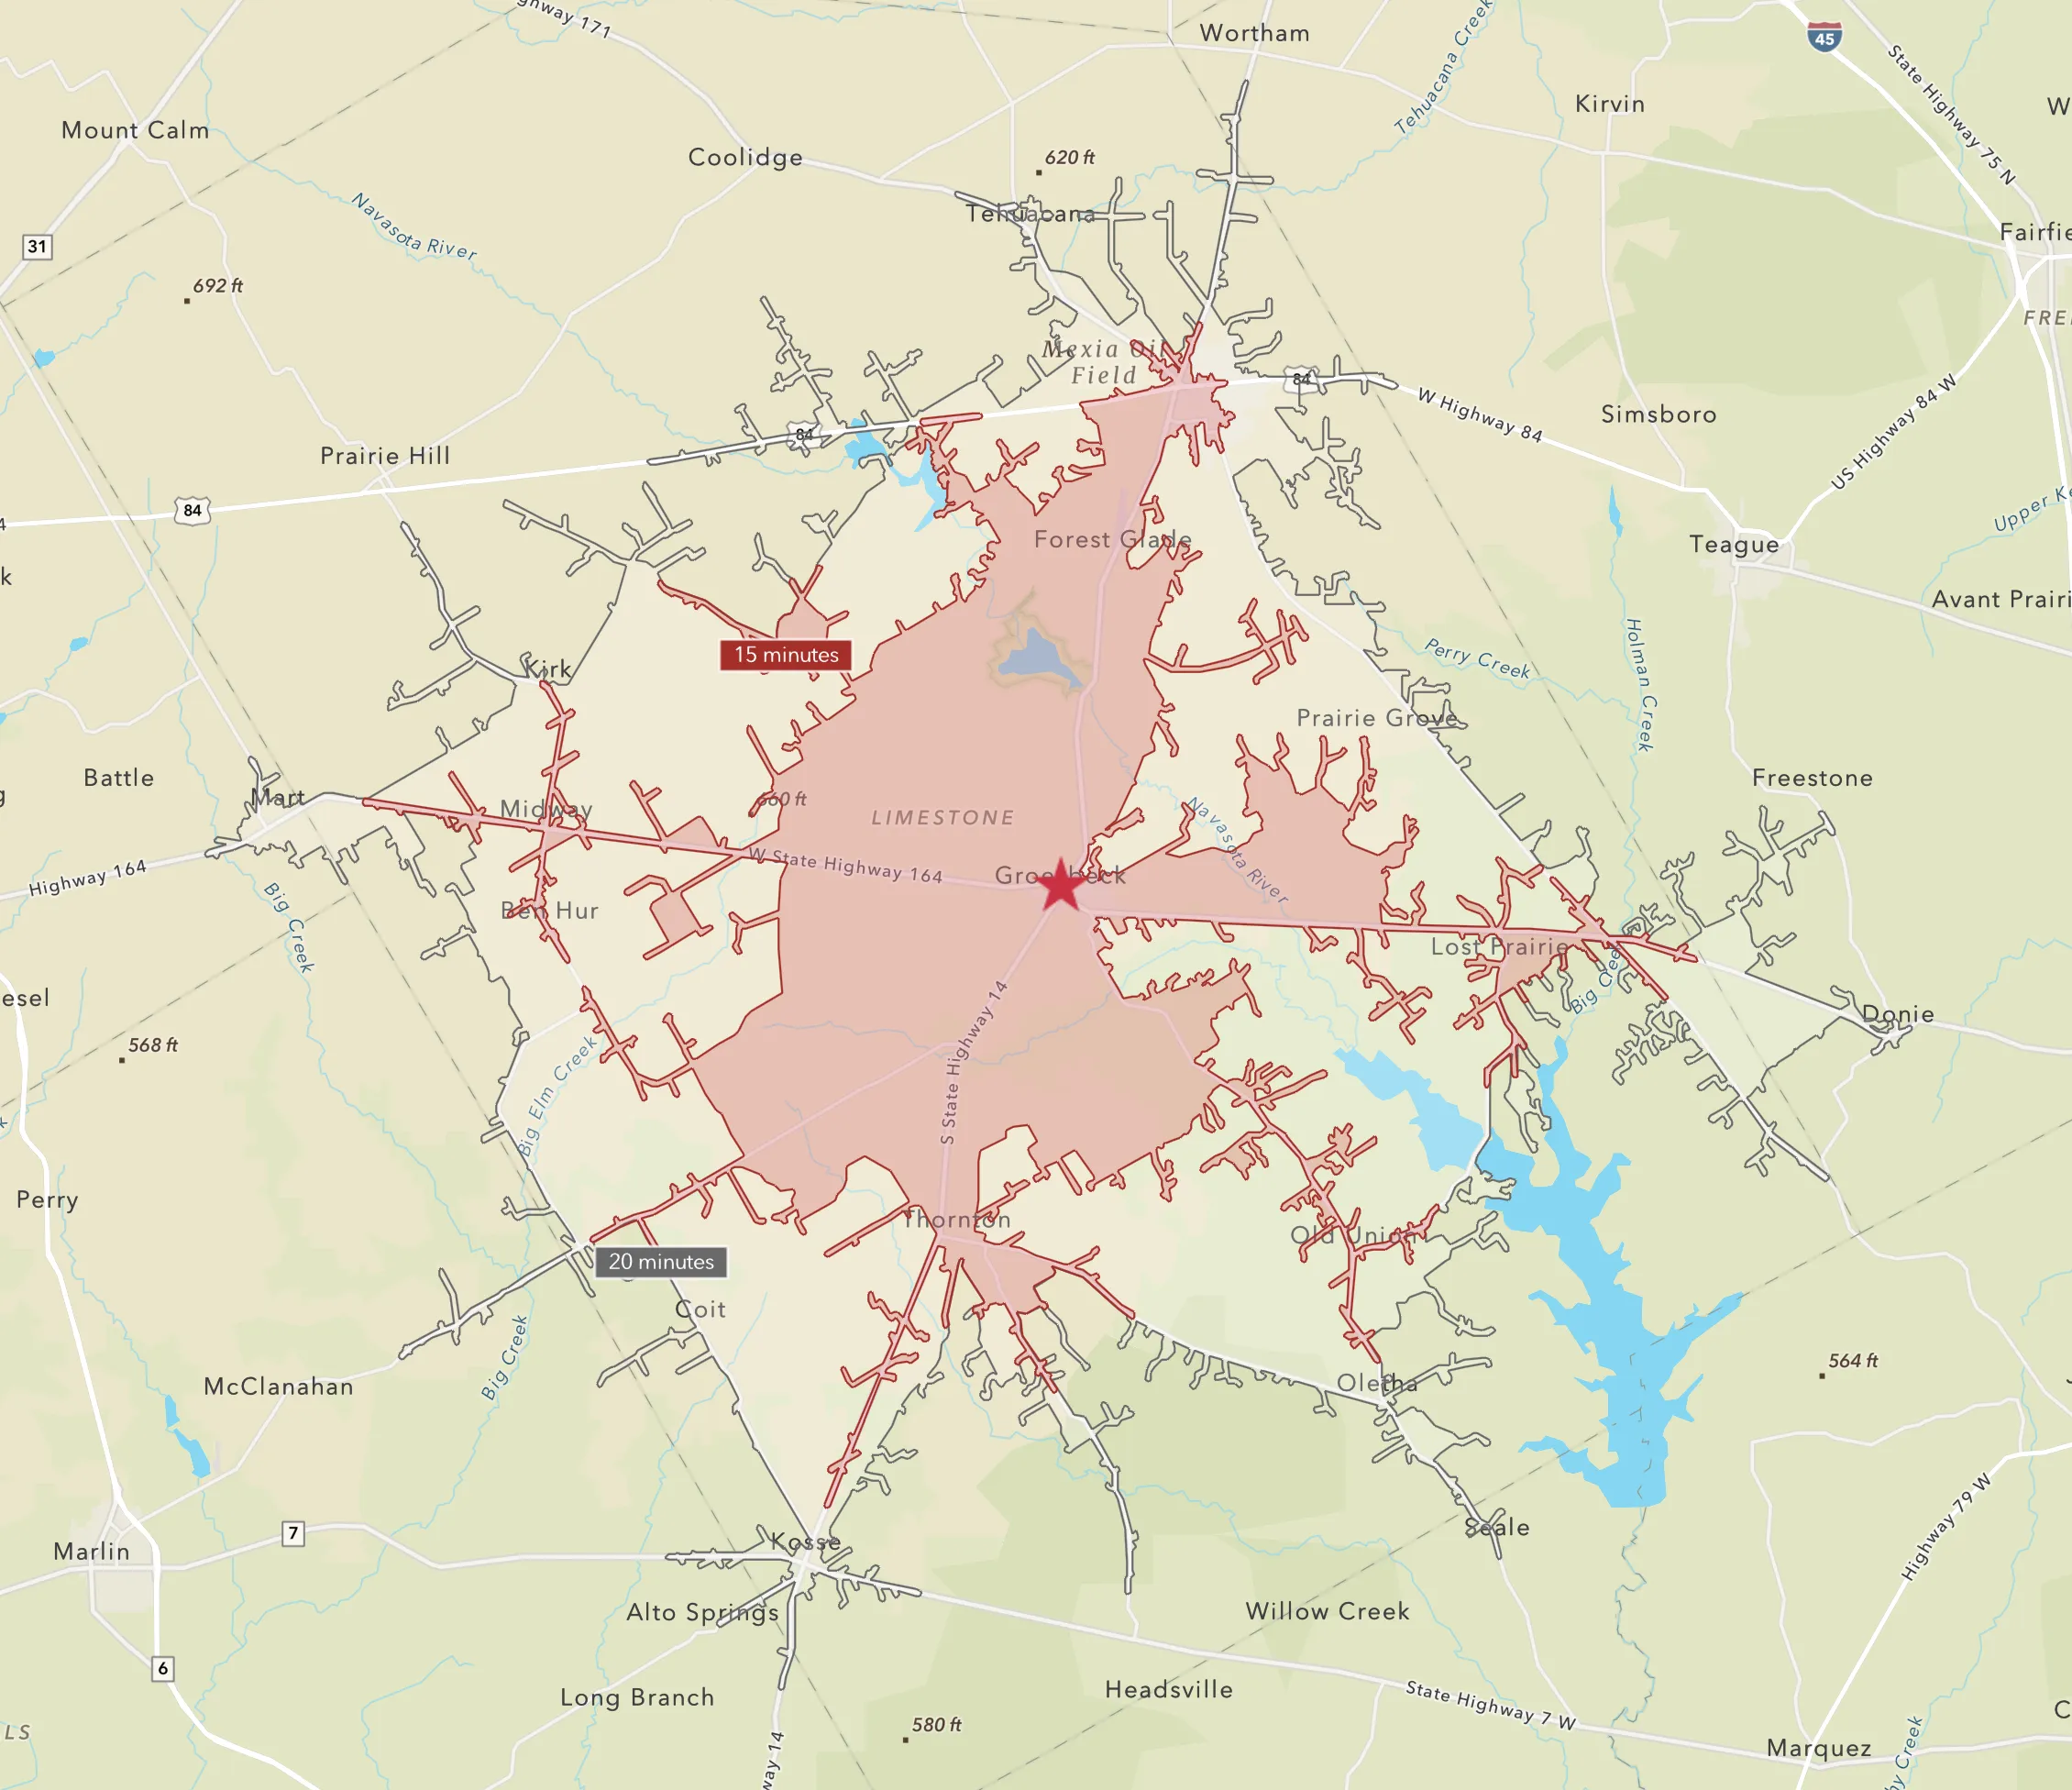
Groesbeck's immediate residential market, based on drive-time access rather than municipal boundaries
Three household types, each with its own habits, priorities and spending patterns, make up 82.3% of households within a 15-minute drive.
Hometown Charm
0%
Younger families and mixed households, with consumer activity oriented toward everyday shopping, dining, and household needs.
15.4
Rural Versatility
0%
Rural households that depend on personal vehicles and regularly purchase everyday necessities, automotive supplies, and home-related goods.
28.9
Rooted Rural
0%
Established rural households, often long-term homeowners, with strong connections to home maintenance, vehicles, and practical purchases.
38.0

3.9%
Greatest Gen
Born 1945 or earlier

20.7%
Baby Boomers
Born 1946–1964

17.9%
Generation X
Born 1965–1980

22.5%
Millennials
Born 1981–1998

23.3%
Generation Z
Born 1999–2016

11.7%
Generation Alpha
Born 2017–present
Source: Esri Business Analyst, 2026 estimates, rural 15-minute drive time. Tapestry descriptions summarized from Esri's segment profiles.
02 / Regional Market Reach
Groesbeck draws visitors from a much wider geography than its residential base. Visitation patterns reveal both a concentrated network of recurring visitors from nearby communities and a broader audience extending across major Texas population centers.
Broader Visitor Origins
Home areas of visitors with 3+ modeled visits a year · click to enlarge
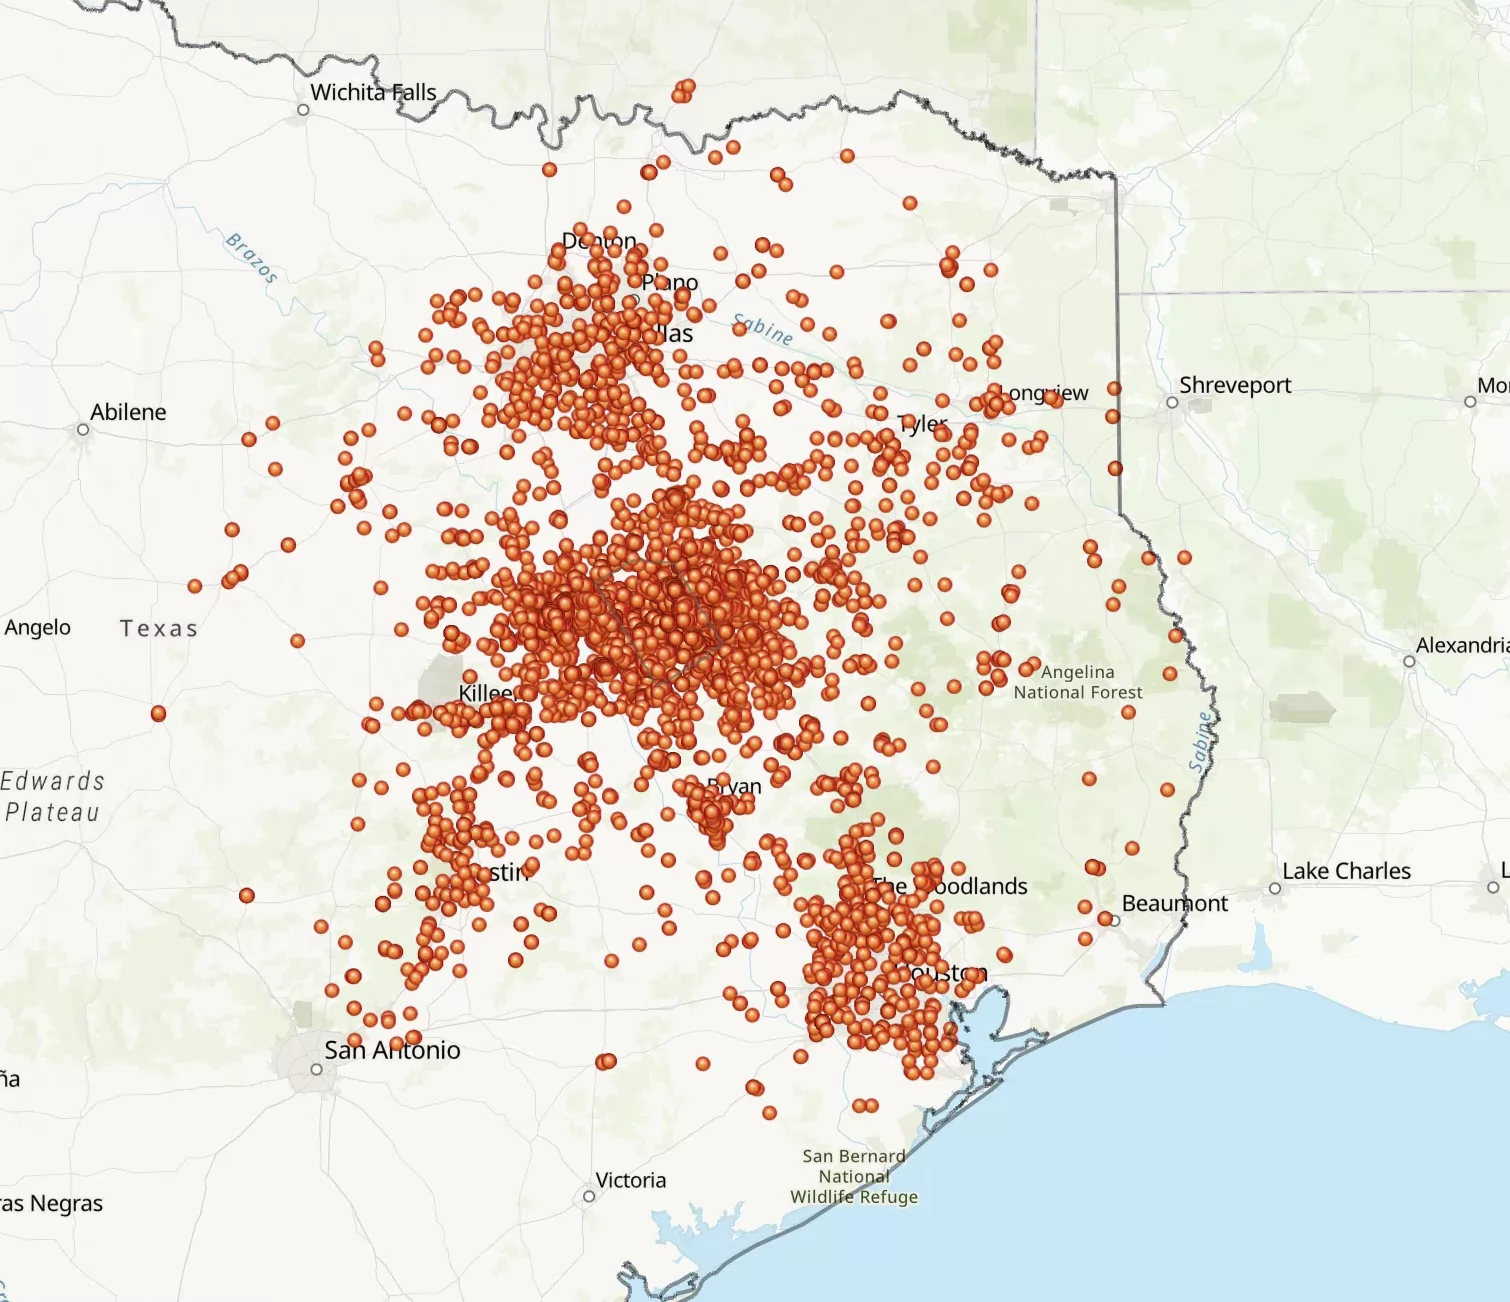
The broader origin footprint reaches Dallas–Fort Worth, Austin, Houston, East Texas, and beyond. These patterns reflect the geographic extent of visitation, not a single fixed retail trade area.
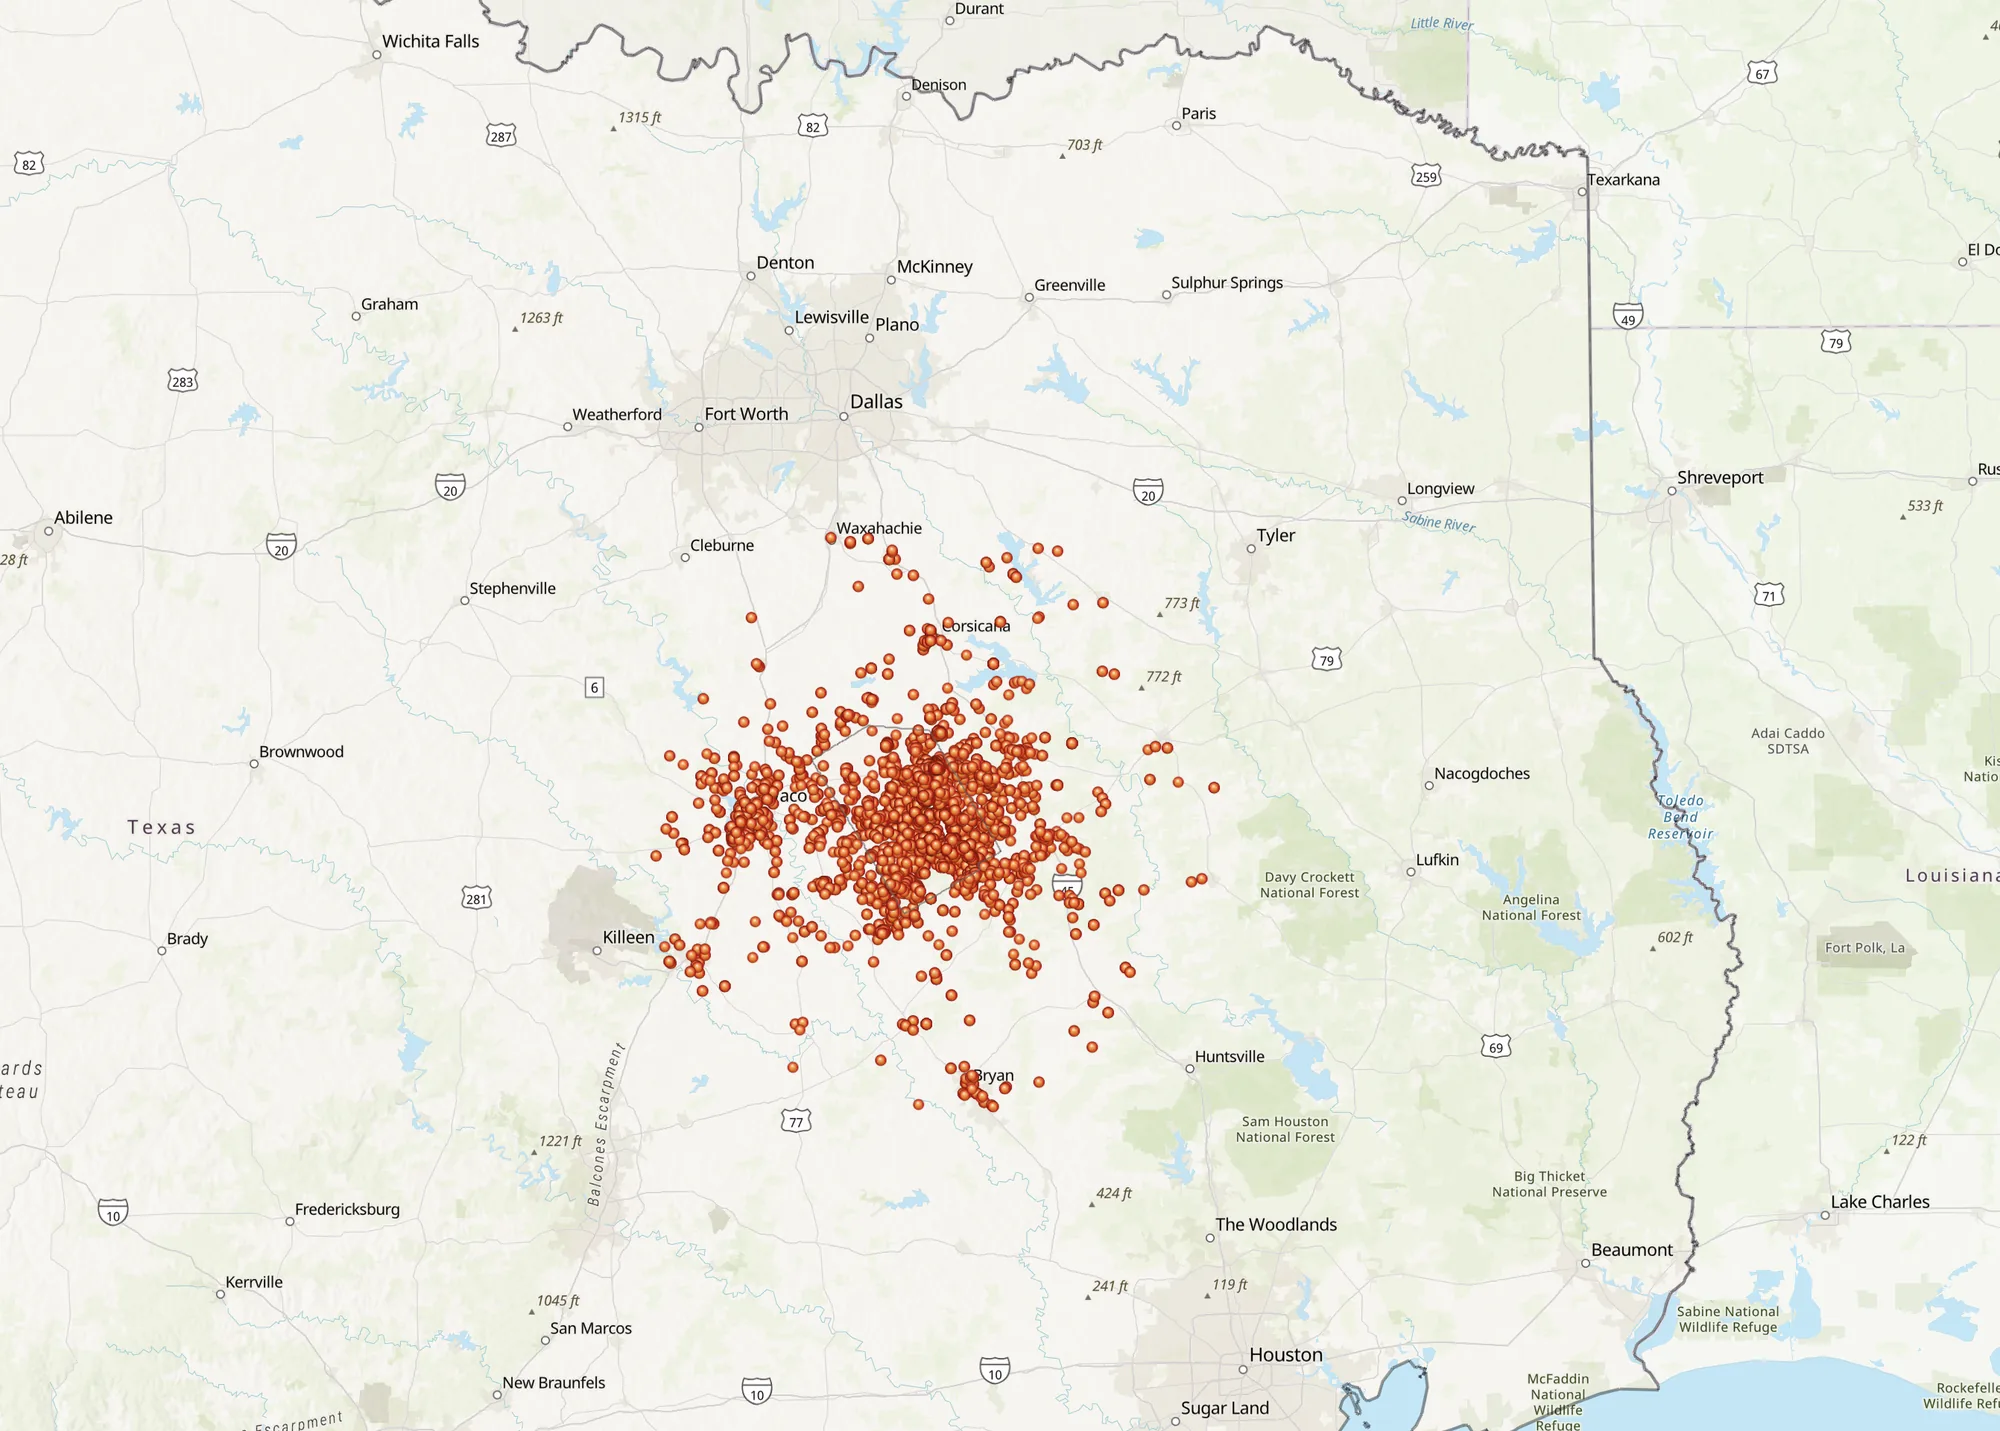
Frequent visitor origins are concentrated throughout Limestone County and neighboring communities, with connections extending toward Waco, Corsicana, Fairfield, Temple, and Bryan–College Station.
Frequent Visitor Origins
Home areas of visitors with 10+ modeled visits a year · click to enlarge
05 / Who Comes to Groesbeck
See who visits Groesbeck
Age, household and lifestyle profiles of the people already coming to town.
Source: Placer.ai citywide visitor home origins. Locations are modeled and privacy-obfuscated; minimum-visit thresholds apply to the mapped geography.
03 / Market Activity
A community's resident population doesn't capture the full scale of its consumer activity. Groesbeck's visitor and visitation figures demonstrate the additional audience entering the market throughout the year.
251.2K
Out-of-market visitors
People who stop here but don't live or work here
1.6M
Visits
Daily visits to Groesbeck; overnight stays count once per night
370K+
Different Vehicles a Year
101,000 came back two or more times
308K
Vehicle Trips a Month
On Groesbeck's four main highway corridors
Total visits increased 2.1% year over year, while the estimated number of out-of-market visitors remained relatively stable. Together, these measures provide a fuller view of market activity than population or visitor counts alone.
Sources: Placer.ai citywide visitation metrics, November 2025 to October 2026. Vehicles: local traffic counts on the four main highway corridors, December 2025 to October 2026 (full months).
Share of highway traffic by corridor
Source: local traffic counts on the four main corridors (outbound lanes), November 2025 to October 2026.
On the road
Different vehicles a day on the main corridors. About 6,400 on a typical Friday, 20% more than other weekdays.
Source: local traffic counts on the four main corridors, November 2025 to October 2026.
When people are here
Peak hours on a typical day.
Out-of-market visitors in town: share of the week by day, and share of the day by hour.
Source: Placer.ai citywide visitation, November 2025 to October 2026.
04 / Extended Visitor Economy
Visitors traveling from more than 50 miles away add another dimension to Groesbeck's market. In the last 12 months, they made an estimated 81,000 trips here and spent about $1.2 million.
81K
Longer-distance trips
Visitors originating 50+ miles away
$1.2M
Estimated visitor spending
Modeled spending associated with qualifying trips
The Dallas–Fort Worth, Houston, and Waco–Temple–Bryan areas are among the leading origin markets. Estimated visitor spending spans grocery and food stores, retail businesses, and restaurants.
Source: Placer.ai Domestic Travel & Tourism Report, October 2025 to September 2026, 50+ mile home distance. This analysis uses different definitions from the citywide visitation estimates.
05 / Who Comes to Groesbeck
Visitor and commuter data profile two groups who come to Groesbeck without living here: inbound commuters and out-of-market visitors. Benchmarked against Texas, they look remarkably alike: established, value-minded households with more wealth than income.
Snapshot vs Texas
Modest incomes, solid wealth
Index: Texas = 100. Above 100 means more than the Texas average.
Lifestyles that over-index
Who they are
Budget-Minded Singles
Cost-conscious, one-person households
Small-Town Boomers
Middle-income boomers in smaller towns
Working Country Families
Younger households balancing work and kids
Settled Empty-Nesters
Older couples, homes paid down, kids grown
Rural Rooted
Country families tied to land and community
Room to grow
Untapped audiences
Under-represented today, but already a bigger share of visitors than commuters. These are audiences to grow, not just serve.
Top-Income Households
High-earning professionals
commuters → visitors
Young Suburban Families
Newer families in growing suburbs
commuters → visitors
Affluent Boomers
Comfortable, active pre-retirees
commuters → visitors
Young Starters
Early-career singles and couples
commuters → visitors
Budget-Minded Singles
Cost-conscious, one-person households
commuters → visitors
Small-Town Boomers
Middle-income boomers in smaller towns
commuters → visitors
Working Country Families
Younger households balancing work and kids
commuters → visitors
Settled Empty-Nesters
Older couples, homes paid down, kids grown
commuters → visitors
Rural Rooted
Country families tied to land and community
commuters → visitors
What draws them
What locals love, and what visitors are looking for
Locals are rooted in land, outdoors and home. Visitors arrive with a bigger appetite for things to do once they're here.
Based on online interests (Spatial.ai social data via Placer.ai), November 2025 to October 2026, ranked within each group. Tags compare how strongly each group shows that interest online versus the other group.
Source: Placer.ai, PopStats and Experian Mosaic household data for inbound commuters and out-of-market visitors, November 2025 to October 2026. Segment names are GEDC’s own.
Every business has its ideal customer, location, and market opportunity. The Groesbeck EDC can work with prospective and existing businesses to explore more specific demographic, consumer, visitation, and trade-area data relevant to their projects.
Whether you're evaluating a new location, considering expansion, or researching your audience, we can help you identify the information needed to make an informed decision.
Request Market Data ↗Founded as a stop on the Houston and Texas Central Railroad, Groesbeck is the seat of Limestone County, set where TX-14 and TX-164 cross in the heart of Central Texas. It’s a small town with a big reach: Waco in 40 minutes, Dallas–Fort Worth and Houston within an easy drive, and Lake Limestone just down the road. A walkable red-brick downtown and deep ranching roots give it room to grow, without losing what makes it home.